REBAR CAGE CENTERING IN DRILLED DEEP FOUNDATIONS WITH THERMAL INTEGRITY PROFILING
M. L. Siverston, P.E., Terracon Consultants, Inc., Charleston, S.C.
Introduction
Drilled shafts are a widely used deep foundation element particularly when heavy loads are to be supported. They are commonly employed in the Transportation Industry as well as for projects in the private sector. Drilled shafts can be designed to carry both axial and lateral loads. Designers generally expect that the shafts will be built as designed. This is of particular importance when steel reinforcing cages are utilized. Proper installation means that cages must be perfectly centered, and calls for competent concrete placement with no intrusions or voids present. A variety of testing protocols can be employed in order to verify the integrity of a shaft. Cross Hole Sonic Logging (CSL) is a frequently used testing regime, particularly when deep, large diameter shafts are called for such as supporting members for bridge foundation. There is however, a newer method of drilled shaft integrity testing that has been introduced called Thermal Integrity Profiling (TIP). TIP can also be used to test the integrity of Auger-Cast-Piles (ACIP). Individual ACIPs are not designed to carry extremely heavy loads as are Drilled Shafts, however they are increasingly being used when appropriate conditions and design parameters are in place. The TIP method is gaining in popularity due in large part to its ease of use and the increased information delivered regarding the shaft.
Thermal Integrity Profiling measures temperatures with respect to depth within the drilled shaft as the concrete hydrates. It has been introduced in the past several years and is progressing from demonstration projects into more conventional use. The test is conducted shortly after the concrete is poured and results can be returned relatively quickly. Thermal Integrity Testing can evaluate the presence of anomalies inside as well as outside the reinforcing cage. Using temperature as a measure, the test can also evaluate the verticality of the reinforcing cage. No other test can provide this level of information regarding a drilled shaft. Since the analysis can occur so quickly, adjustments to construction techniques, such as enhancing verticality of the cage or improved cleanout of the bottom can be conducted in order to improve the overall integrity of the next production shaft to be installed.
Two Tests are presented as examples of the use of the TIP methodology. The first focuses on Drilled Shafts. The second on Auger-Cast-Piles.
Thermal Integrity Profiling: An Overview
Thermal Integrity Profiling is an emerging technology developed by Dr. Gray Mullins, P.E., Professor of Civil Engineering, University of South Florida * The test measures the heat developed by the curing of concrete. The heat developed will change over time, gradually increasing after it is mixed, and then reaching a peak temperature before cooling to ambient ground temperatures. The test is generally conducted during the heating phase as the concrete hydrates. Temperatures collected during the test are compared between different points either vertically or horizontally to identify and evaluate heating or cooling trends.
Three variables will affect temperatures: cement content, geometry of the shaft, and external environmental conditions. As the cement content increases, the heat generated by hydration will increase. A larger thermal mass will provide more heat than a smaller thermal mass. External conditions such as the shaft passing through a river will provide additional cooling during hydration. Wires placed on opposite sides of the shaft that appear hot on one side and cold on the other are indicative of a shift in the cage alignment. By considering these variables, along with routine construction details, a model of the shaft can be developed. The analysis of the recorded temperature to predict the radius, concrete cover verticality of the reinforcing cage and 3D representation of the shaft is performed using the TIP Reporter Software developed by Pile Dynamics Inc. and is based on the work of Dr. Mullins.
Example 1 – Drilled Shaft • Myrtle Beach, South Carolina
Bent 2 Shaft 4 was constructed in the Myrtle Beach area of South Carolina for a new highway overpass. The shaft has full-time inspectors monitoring its construction. Terracon Consultants, Inc. performed TIP and CSL testing to evaluate the shaft’s integrity. The TIP test was performed using embedded thermal wires and run for 49 hours. Several days later, a CSL test was performed to further evaluate the shaft.
The shaft extended from the ground surface to a depth of 93 feet. The 82-inch diameter shaft was excavated on November 3, 2016. During construction a bentonite slurry was used to maintain the stability of the excavation. Excavation and cleaning operations continued until November 8. Prior to inserting the reinforcing cage, the sand content of the slurry was checked and the shaft was inspected for cleanliness by sounding the bottom using a weighted tape. Concrete placement began in the early afternoon of November 8th and continued for approximately 4 hours. The reinforcing cage was then inserted and plastic wheels affixed to the cage were used to help keep the cage centered within the shaft excavation.
Seven strings of thermal wires were attached to the reinforcing cage on November 7. At 11:18 am on November 9, the TIP testing was initiated by attaching data loggers to thermal wires. Data was collected for 49 hours before the test was terminated. The data was then processed the same day in order to gain an early indication of the findings. Beginning on page 4, Figure 1 presents the temperature vs depth from the TIP test. Areas with increased temperature generally correspond to bulges. Opposing wires that are relatively cold and hot indicate a shift in the reinforcing cage. Figure 2 is a presentation of the analysis that can be performed using the shaft construction characteristics and temperature data. Figures 3 is a three dimensional model of the shaft based on the analysis.
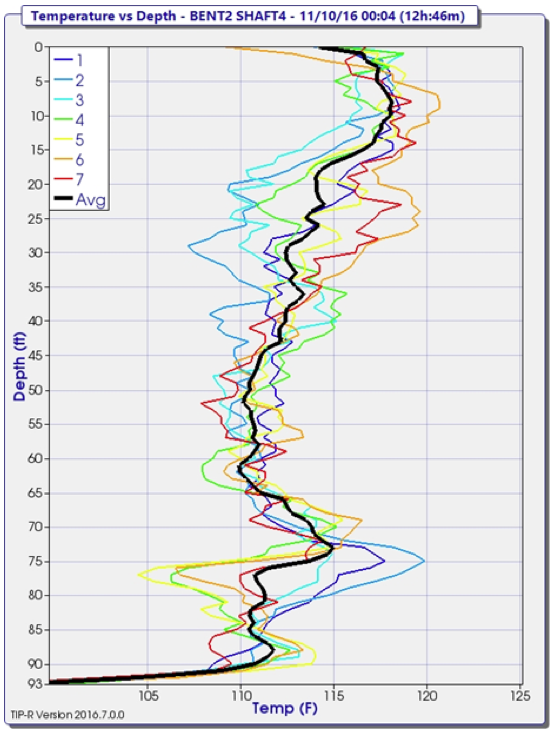
Figure 1: The graphical representation of the thermal data collected. Each wire is presented as a different color corresponding to the legend at the top left corner of the figure. The temperatures are averaged and this average is depicted as the dark black line. The separation of wires 1 and 4 most significantly around 25 feet and again at 75 feet is indicative of the cage leaning north then inverting to the south the deeper in the shaft.
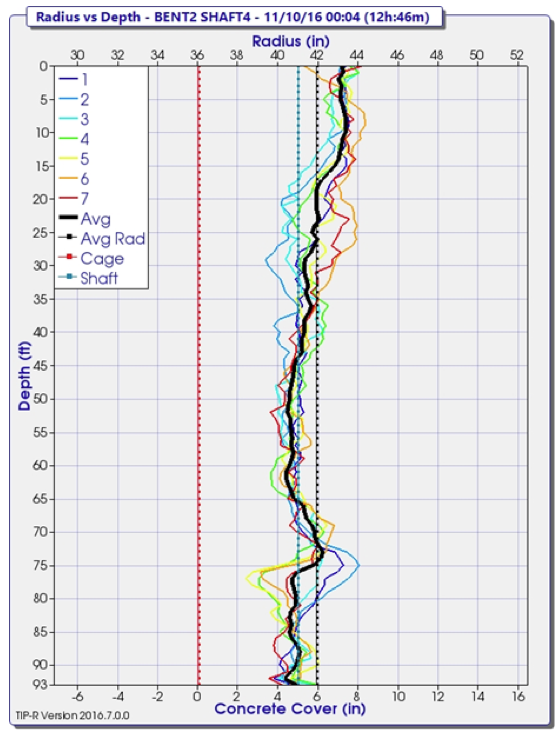
Figure 2: The graphical representation of the shaft radius and concrete cover of the reinforcing cage. The thermal wires 1 to 7 are represented in by the colored lines as indicated in the upper left corner of the graph. The heavy black line is an average of the seven wires with depth. The top X axis is Shaft Radius while the bottom X axis is Concrete Cover of the reinforcing cage. The dashed red line is the position of the reinforcing cage while the dashed purple line is the design diameter of the shaft. The average of the average heavy black line is presented as the dashed black line. The data indicates that the shaft has an average radius of 42 inches but this varies with depth. The amount of concrete cover varies with depth and is affected by the cage shift.
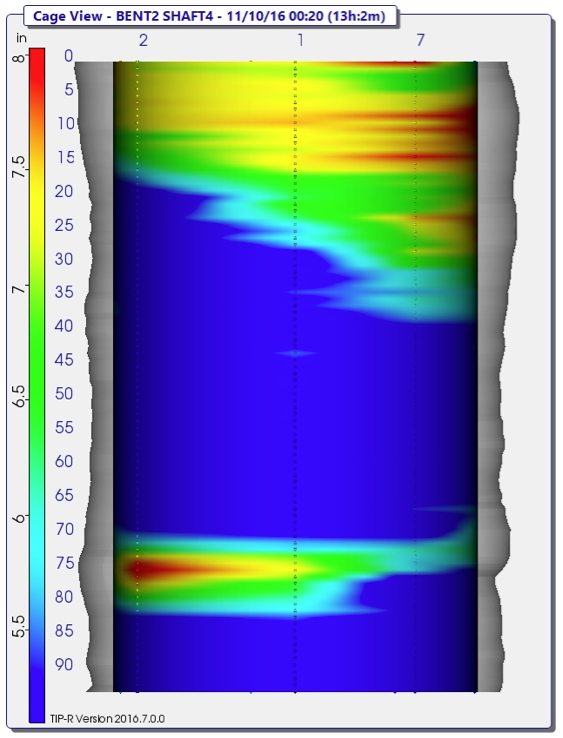
Figure3: A 3 dimensional representation of the shaft viewing form the northern side of the shaft. The model is based on the construction logs and the recorded temperatures. The colors correspond to concrete cover with the dark blue being around 5 inches and red being 8 inches of cover.
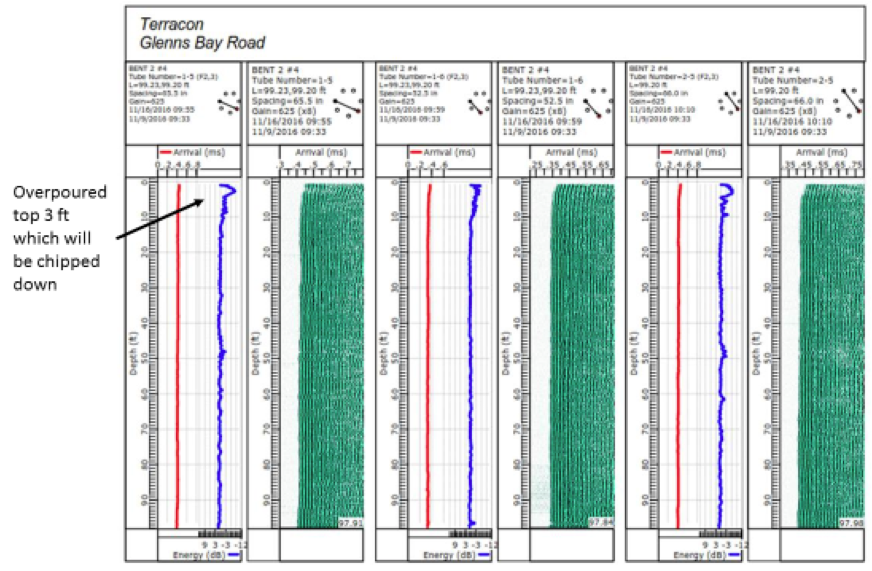
Figure 4: The CSL cross sections that were performed on Bent 2 Shaft 4 by Terracon. Note that the shaft was over-poured by 3 feet which was later chipped away.
TIP Results of the Drilled Shaft Test
The shaft appears to be in good condition with no detectable anomalies. Based on the data collected several characteristics of the shaft can be deduced.
- Cage shift is present throughout the shaft with significant leanings north around 25 feet and south at 75 feet.
- A minor bulge is present around 73 feet.
Based on the thermal data collected from the shaft and our review of the concrete placement log and the provided project information, it was recommended that the shaft is acceptable.
Example 2 – Savannah Auger Cast Pile
Auger Cast-In-Place (ACIP) piles were selected as the foundation system for a large residential development in the Savannah Georgia area. A total of four hundred ninety two Auger Cast In-Place piles were installed for the facility. The piles were 16 inch in diameter and extended to a termination depth of 71 to 76 feet below the ground surface. The grout has a design compressive strength of 5,000 psi with a grout factor of 1.25.
On March 27, 2014, four hours after the grout was placed, Terracon personnel initiated Thermal Integrity Testing on ACIP pile #370 recording temperatures for approximately 24 hours. The pile was also tested with Single Hole Sonic Logging for the purpose of independently determining pile integrity. A summary of the Thermal Integrity Testing and pile construction information is presented in Table 1, which includes the ACIP pile installation date and time following grout placement. These are theoretical and actual grout volumes. It should be noted that no significant deficiencies or irregularities were observed during drilling and no significant deficiencies or irregularities were observed during grout and steel reinforcement placement.
The test was conducted by lowering the thermal wire within the center access tube that was subsequently used for Single Hole Sonic Logging. The test in pile #370 was initiated approximately 4 hours after the grout was placed and data was collected for around 24 hours. The access tubing consisted of 1½ inch diameter Schedule 40 PVC tubing filled with water.
It is assumed that the pile is straight and centered for the analysis. Without using opposing wires, it is impossible to determine if cage shift is occurring within the pile. If the alignment is less than vertical, the temperatures will drop as the outer edge of the pile is approached and the analysis will incorrectly predict a necked pile. Therefore proper centering of the pile is crucial.
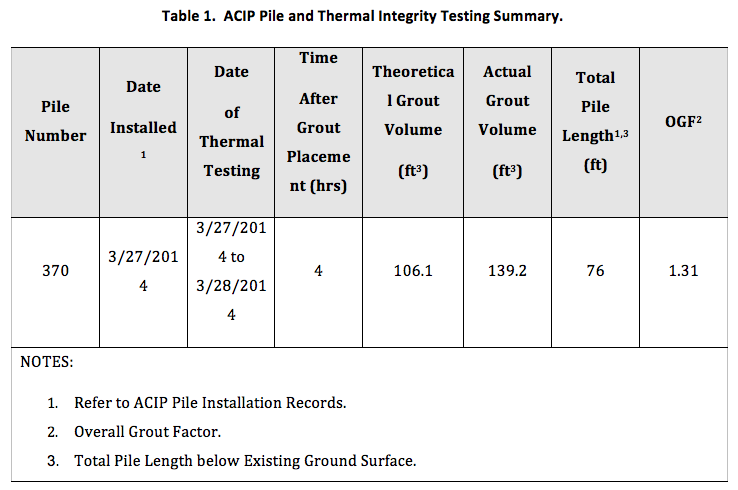
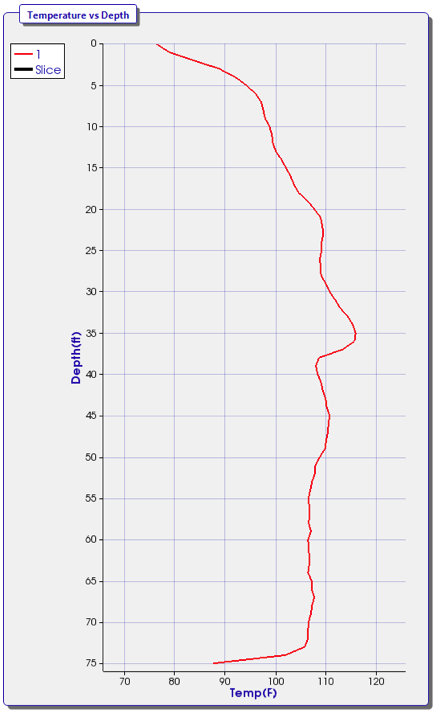
Figure 5: A graph of the measured peak temperature vs depth within ACIP #370. There is a spike in temperature around 35 feet below the ground surface which corresponds to a bulge. Above the bulge, the temperatures gradually increase which is typical of ACIP profiles. Below the bulge, the temperature is more consistent.
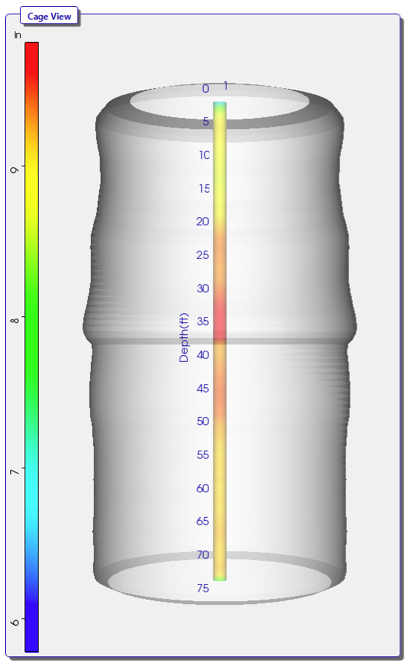
Figure 6: A 3D model of ACIP #370 with a color bar indicating approximate pile radius with blue corresponding to 6 inches or less and red being 10 inches or greater. A bulge is noticeable at 35 feet below the ground surface, below which the profile is generally consistent. Above 35 feet, the temperatures vary which correspond to a vase-like shape.
TIP Results ACIP #370
The thermal data indicates that ACIP #370 has no apparent anomalies. The pile is designed to have a radius of 8 inches. Based on the temperatures and grout volumes, the pile has a radius that varies from 8 ¼ to 9 inches in the upper 35 feet. A minor bulge has developed around 35 feet which expands the radius to approximately 9¾ inches and below this a more consistent radius of 9 to 9¼ inches is calculated. Figure 5 provides a graph of the temperature vs depth within ACIP #370. Figure 6 is the processed data with a 3D rendering of the pile.
Single Hole Sonic Logging
Single Hole Sonic Logging (SSL) was performed 2 days after the pile #370 was poured. The SSL results for pile show only minor deviations in First Arrival Time and relative energy along the length of the access tubes with no exceptions. The minor fluctuations are less than 10% and therefore can be considered insignificant. The data is presented in Figure 5 below. The SSL test results for ACIP #370 are in agreement with the TIP and do not detect any significant anomalies.
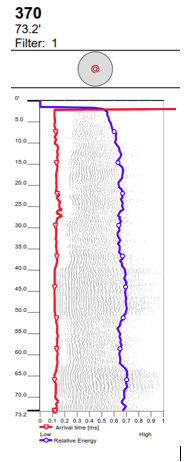
Figure 7: The Single Hole Sonic Log data for pile #370. There are minor fluctuations in First Arrival Time and Energy but these are less than 10% and considered to be minor.
Conclusions
Thermal Integrity Profiling is a reliable test method to evaluate drilled shafts and auger-cast-pile foundation systems. The TIP test accurately predicts the presence of anomalies within the shaft or auger cast pile. When compared to conventional CSL testing, the results are in good agreement. However, TIP testing also provides information regarding of the quality of the shaft outside the reinforcing cage. It predicts the concrete cover and effective radius as well as verticality of the reinforcing cage. Since the test can be performed shortly after the shaft or pile is poured, adjustments to construction techniques can be made quickly to add more centralizers or provide additional cleaning to the bottom of a shaft.
Mullins, A. G., (2010), “Thermal Integrity Profiling of Drilled Shafts”, DFI Journal Vol 4, No.2, December.
Mullins, A. G. and Kranc, S. C., (2004), “Method for Testing the Integrity of Concrete Shafts,” US Patent 6,783,273.
Silveston (2015) “Enhancing Reliability and Quality of Drilled Shafts Through Thermal Integrity Profiling”, 28th Central Pennsylvania Geotechnical Conference
ABOUT THE AUTHOR:
 Matt Silveston is a Professional Engineer and Senior Principal at Terracon Consultants, Inc. Mr. Silveston specializes in deep foundations, geotechnical engineering and material testing. He graduated from Georgia Tech with a BS in Civil Engineering and went on to the University of Texas to get his Masters in Geotechnical Engineering. He has over 19 years of experience working on projects ranging from commercial developments to large infrastructure projects. Contact Info: MLSilveston@terracon.com • 843-884-1234 • Terracon Consultants Inc, 1450 Fifth St West, North Charleston, SC 29405
This article was produced under the auspices of Pieresearch, manufacturer of quality concrete accessories, exclusively for the benefit of the structural and geotechnical engineering, architectural and construction communities and is copyrighted by Pieresearch 2017.